Each year, in mid-December, the federal government releases its calculation for what each province is entitled to receive as equalization. This time, the numbers are especially important.
They show how much Alberta’s recession lowered its ability to raise revenues. They show Ontario has graduated to “have” status, but (interestingly) will still receive equalization payments. They also set the stage for the upcoming Federal-Provincial-Territorial discussions over the soon-to-expire formula. And on top of all this, budget challenges in oil rich provinces of Alberta, Saskatchewan, and Newfoundland and Labrador put equalization payments front and centre in provincial political debates, where misleading claims are unfortunately all too common.
Let’s see what the latest numbers say.
Equalization is complicated. And for detailed inner workings of the program, interested readers should see this report from the School of Public Policy and this one from the Parliamentary Budget Office. But the basics are fairly straightforward.
Equalization is a federal program that transfers federal funds to provinces with below average capacities to raise revenues. Provinces with stronger economies, and with high income households and businesses, raise more revenue for any given tax rate than provinces with lower incomes. This is true not just of personal and business income taxes, but also of sales and property taxes. Importantly, resource revenues like oil and gas royalties also go into the formula, but only 50% count in the formula (to preserve the incentive to develop a province’s resources).
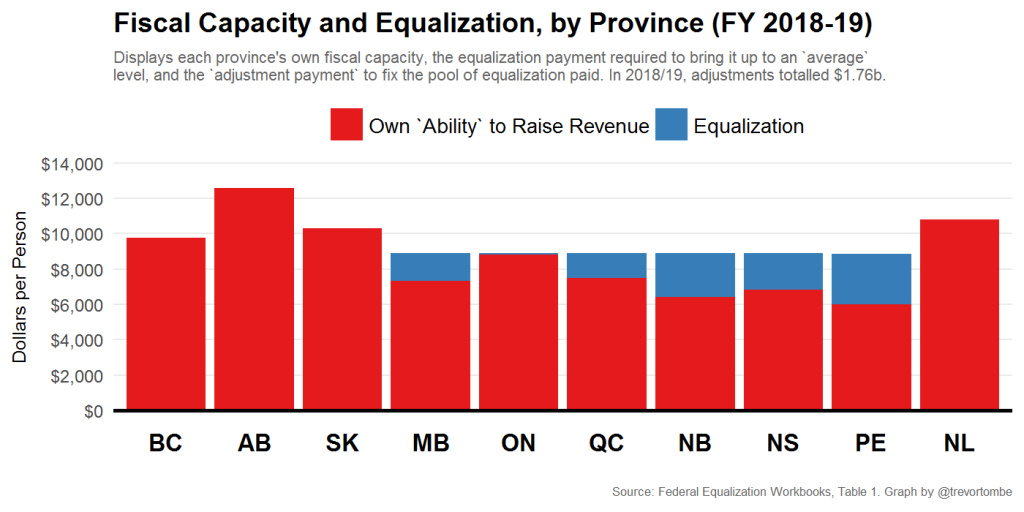
With all this in mind, equalization asks a simple question: How much revenue would each province raise with tax rates equal to the national average? This is a province’s “fiscal capacity”. If a province would raise less than the average amount, per person, the federal government tops it up. I illustrate the 2018/19 results below.

Total payments (in blue) add to $18.96 billion in total, and range from $70 per person in Ontario to $2,835 per person in Prince Edward Island.

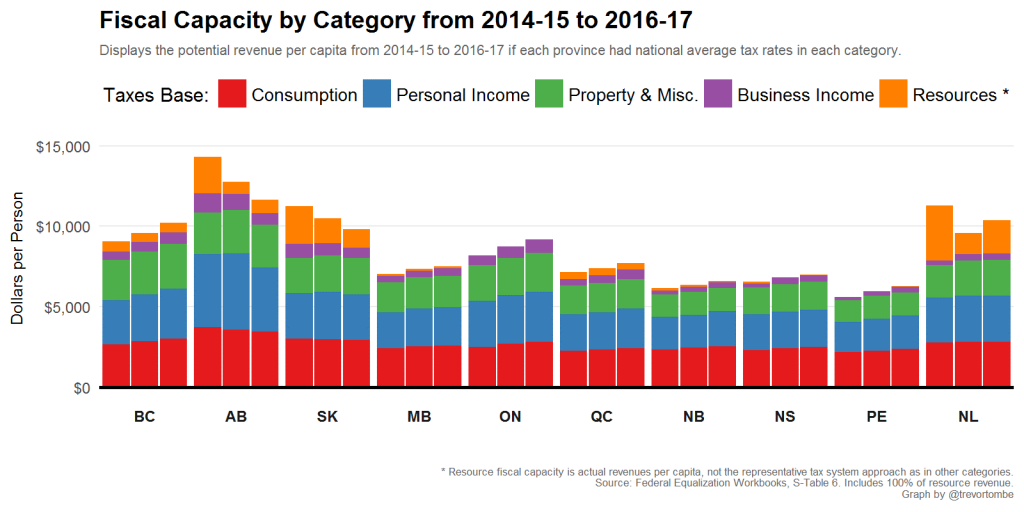
A number of taxes and other information go into determining fiscal capacity. Lags in data mean 2018-19 payments use data only up to 2016-17. And to help improve the stability and predictability of payments from year to year, the formula also uses an average of the three prior years. So, the latest payments are based on 2014-15, 2015-16, and 2016-17. Here’s the results:

Notice that even the 2016-17 data reveals very high fiscal capacity for Alberta — higher than all other provinces, at $11,637 per person — even during the depths of its recent recession. That being said, the recession did have an effect. Alberta’s fiscal capacity is 19% lower in 2016-17 (the recession’s bottom) than it was in 2014-15 (its pre-recession peak). This drop largely reflects the lower household and business income associated with low oil prices, along with the drop on government resource revenues.
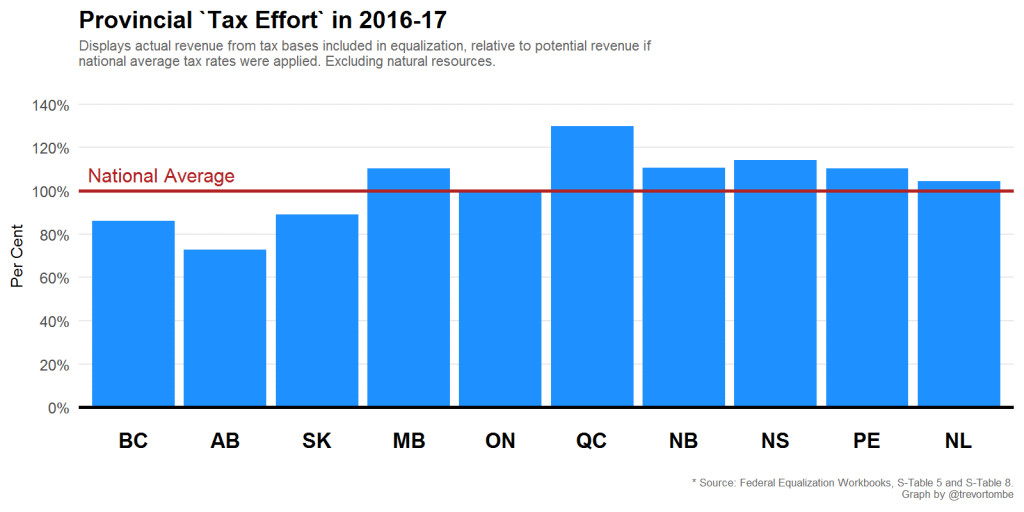
But why does Alberta have a deficit if its fiscal capacity is so high? Simple: its tax rates are low. To illustrate this, I plot Alberta’s actual revenue as a percentage of what could be raised if each province had tax rates equal to the current national average. Alberta is, by far, the lowest tax jurisdiction (nearly 30% below the national average) while Quebec is the highest (nearly 30% above). Alberta’s deficit is a choice, and largely unrelated to the federal equalization program.

When calculating actual equalization payments, there are a few complications and important subtleties to consider beyond just fiscal capacity. And they can matter a lot.
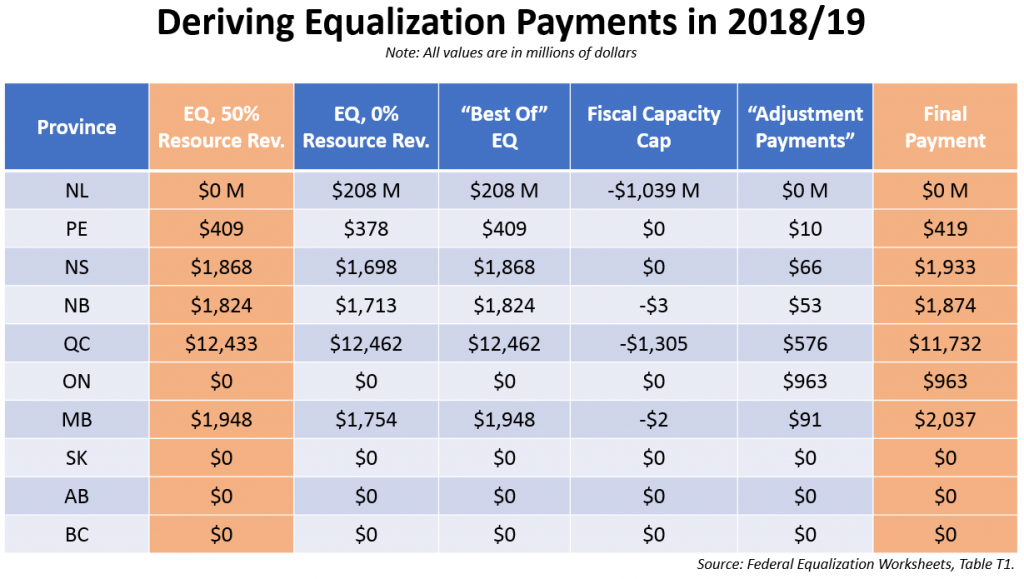
In the first column of the following table, I display the basic results from what is “step 1” of the formula (which simply tops provinces up to the “average”). In the last column, I display the amount each province receives in 2018/19. For Ontario and Quebec, there are notable differences.

The middle four columns reflect various adjustments to the basic formula. First, there’s a “best of” feature of the formula whereby provinces are evaluated with 50% of resource revenues included and with 0% included. Whichever results in the highest equalization payment is what a province is entitled to.
Second, since the formula doesn’t count all resource revenues, there are situations where an equalization receiving province could benefit “too much” from the program. This year, and at this stage of the formula, Ontario isn’t an equalization receiving province which makes things simple: If a province receiving equalization would be made better off than Ontario, then the excess is clawed back. This is called the “fiscal capacity cap” (FCC).
To illustrate, Newfoundland and Quebec, including all revenue sources and their pre-FCC equalization, would have total per capita fiscal capacities of $10,794 and $8,990 respectively. But Ontario has total capacity of only $8,832. Thus, Newfoundland loses all its equalization entitlement and Quebec has $158 per person clawed back so it does not exceed Ontario (or $1.305 billion in total).
Finally, the total amount of equalization payments is set to match a fixed share of Canada’s GDP. This year, the total equalization pie is set at $18.96 billion. If the total amount exceeds this level, then payments are clawed back on an equal per person basis. If the total amount of equalization falls below this level, then additional payments are made. These top-ups are known as adjustment payments.
This brings us to Ontario. The $963 million it will receive in equalization is entirely composed of adjustment payments. Absent these payments, the total equalization program would cost $17.2 billion and Ontario would receive nothing. But at $70 per person for receiving provinces, the adjustment payments add $1.76 billion, which brings the total cost of the program to the $18.96 billion dollars paid in 2018/19.
Why should adjustment payments be made at all? And why should they be paid to Ontario, a “have” province prior to this stage of the formula? The limit was put in place by the previous government in 2009 to keep costs under control and limit uncertainty. But why does it also act as a floor? And… must it? The Fiscal-Arrangements Act is somewhat ambiguous on this point.
Section 3.4(5) of the Act states that the aggregate of equalization payments “shall be equal to” an amount that evolves along with GDP; this year, that amount is $18.96 billion. Seems straightforward enough, but the complication arises when one continues reading.
In Section 3.4(6), it says that if the aggregate of equalization payments that would otherwise be paid exceeds this $18.96 billion then “equalization payments … shall be reduced by the amount determined by … [formula]” (emphasis added). That’s fine, and the formula is straightforward. But in Section 3.4(8), the Act says that if aggregate payments that would otherwise be paid falls below $18.96 billion then “there may be paid to a province … an adjustment payment… determined by… [formula]”. The word “may” implies the existence of some option not to make such a payment.
That being said, we shouldn’t make too much of the word “may”. The very opening of the Act notes that “equalization may be paid to a province”. Not being a lawyer, I have no idea whether the adjustment payments are required (strictly speaking) or not. Given the use of “may” elsewhere in the Act, there’s likely a subtle legal point at issue here. But I’ll note that the PBO report cited earlier agrees with the plain language interpretation that the Minister of Finance has discretion on providing adjustment payments or not (see page 7).
Legalities aside, whether equalization does or doesn’t have a floor is ultimately a policy question for the government. We are currently in a time where the degree of inequality in fiscal capacities is lower than recent years, which means equalization payments should (by its own formula) be lower. For equalization to remain fixed at a predetermined level, regardless of actual degree of regional fiscal inequalities, is problematic. In any case, this issue — along with many others — should make for some interesting discussions between the Federal, Provincial, and Territorial governments in 2018.
Trevor Tombe is a research fellow at The School of Public Policy, and associate professor in the Department of Economics at the University of Calgary.